NosJakiaron - Visualizing the Reality of Cyberattacks in Spain 🇪🇸
In today's digital world, cyberattacks are a constant threat, and unfortunately, Spain has become one of the most affected countries. But how can we understand the magnitude of this problem, and above all, how can we make this information more accessible and visual?
NosJakiaron is an innovative project, developed with Next.js, that aims precisely to offer a clear and concise vision of the latest cyberattacks and threats our country has suffered.
What is "NosJakiaron" from a technical perspective?
NosJakiaron is a web application built on the robust Next.js framework, allowing us to create a fast and optimized user experience.
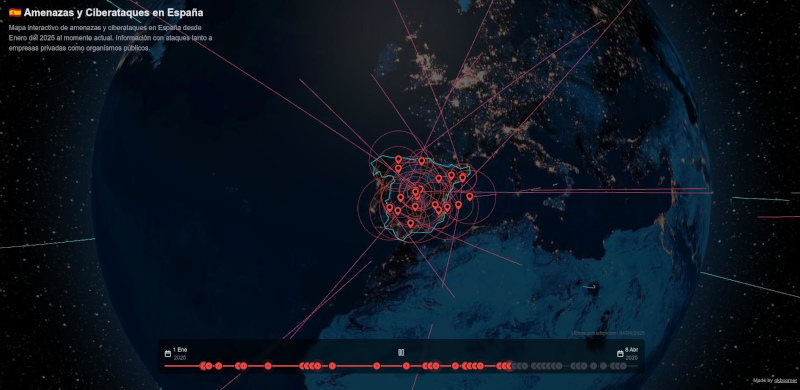
For visualization, the power of react-globe.gl has been used, a library that enables us to map geographical data interactively
and attractively. This is crucial for understanding the spatial impact
of these attacks.
The key to this project lies in data visualization.
From January 1, 2025, to April 4, 2025, information on cyberattacks in Spain has been collected. And where do we obtain this data? Directly from the valuable information shared by @H4ckmanac on X, a data source that keeps us informed about the latest threats.
In addition to react-globe.gl, the project makes extensive use of Radix UI components for a flawless and accessible user interface, Tailwind CSS for modern and responsive styling, and Zod along with React Hook Form
for data validation, ensuring the application's robustness.
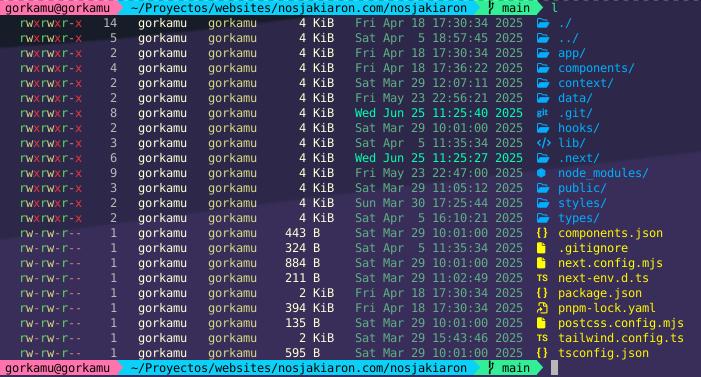
State management relies on a clear folder structure (such as components, context, data, hooks, lib, styles, types), demonstrating an organized and scalable development approach.
The Heart of Deployment: Serverless with Netlify 🚀
A fundamental aspect of NosJakiaron is its deployment architecture. A serverless strategy on Netlify has been chosen, meaning that the "build" and "deploy" process is super efficient and scalable.
When we make changes to the code and push them to the main branch of our repository, Netlify automatically detects those changes
and then executes the next build script defined in our package.json.
This Next.js command is responsible for:
- Optimizing the code: Transpiling React, JavaScript, and TypeScript code, and optimizing assets like images and CSS.
- Generating static files: Creating a static version of the application (HTML, CSS, JS) that can be served directly by Netlify's CDN (Content Delivery Network).
- Compiling Serverless functions: For any functionality requiring a backend (like Next.js API Routes), Netlify compiles them as serverless functions (Lambdas in AWS, but abstracted by Netlify), which execute only when needed.
Once the build is successful, Netlify handles the deployment, distributing these static files and serverless functions to its global network of servers.
This ensures that the application is incredibly fast for users worldwide and that, moreover, its maintenance is minimal.
Why is visualizing these attacks on a map so important?
Spain, unfortunately, tops the list of countries with the most cyberattacks. Understanding where and how these incidents occur is not just a matter of curiosity, but an urgent need for citizens, businesses, and security organizations.
Visualizing these attacks on a map allows us to:
- Identify patterns: Are there more affected areas? Do attacks concentrate on certain types of infrastructure?
- Raise awareness: Display the frequency and distribution of cyberattacks in an impactful way.
- Facilitate decision-making: Provide valuable information for resource allocation and the development of cybersecurity strategies.
NosJakiaron is not just a map; it is a tool to better understand the cybersecurity landscape in Spain. It is a testament to how technology can be used to educate and prepare society against digital threats.
This project is an example of how I can transform complex data into something comprehensible and visually appealing, using modern technologies and following best development practices, including efficient and scalable deployment.
If you are interested in cybersecurity, web development, or simply want to see how attacks are mapped in our country, I invite you to visit https://nosjakiaron.okboomer.sh/
Information is power, and in cybersecurity, it is even more so!